Visualize bed flatness with gnuplot
Even a badly-warped bed can look pretty flat to the eye. I used the following procedure to visualize my printer’s bed using gnuplot. I used manual bed leveling to measure, and I took advantage of auto-scaling in gnuplot to accentuate variance in Z rather than worrying about dimensions.
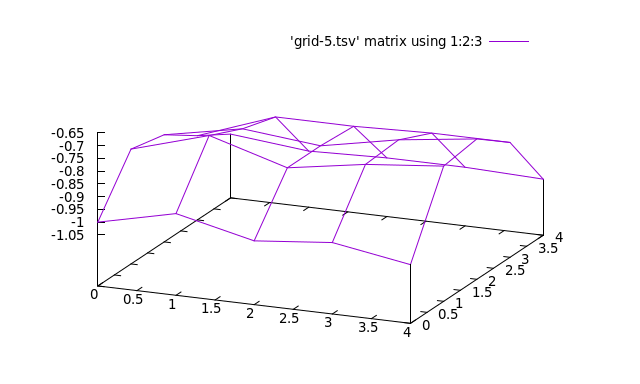
I have Marlin set to do manual bed leveling with 5 points. There’s not much point in doing this with fewer, I think.
I brought up a spreadsheet program and entered in the readings in cells that followed the boustrophedonic testing pattern, so that the readings were arranged the same way in the spreadsheet as the test points on the bed. (Note that because of the way gnuplot interprets the data, you’ll want to put the front row as the first line; visualize the data as “looking up at the bottom of the bed” and it will make sense.) I saved the readings in a tab-separated value (TSV) file, which looks like this:
-1 -0.93 -1 -0.97 -1.02
-0.8 -0.71 -0.8 -0.75 -0.72
-0.83 -0.77 -0.8 -0.74 -0.7
-0.92 -0.81 -0.81 -0.8 -0.8
-1 -1.03 -1.02 -1.02 -1.03
(I had intentionally set Z high for this test; only the variance is interesting.)
Then I plotted it with gnuplot:
splot ‘grid-5.tsv’ matrix using 1:2:3 with lines
After this, I can rotate the 3D plot with the mouse to see the variations better. Here’s how it accentuated where .33mm of total Z variance was distributed across my Tronxy X5S bed. It let me see that the middle is pretty flat, and that variance is concentrated in Y.
(All this confirms that rolled aluminum plate 330mm x 330mm hot bed looks like a lost cause and I should buy milled cast plate, but that’s another post!)

 Heat expansion too, but that’s more of a couple of degrees C…