I’ve got a PI in my workshop with a datalogger of my own devising that monitors various things including the environment; temperature. humidity and pressure. It dumps the readings into a database every few seconds and can be made to give arbitrary time period graphs.
When I look at the pressure graph from Saturday I see:
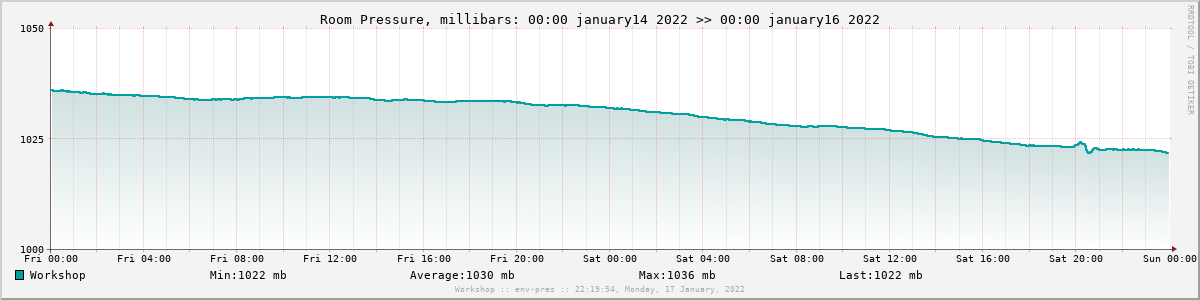
The blip around 8pm is the pressure wave from the Hunga Tonga eruption passing over Europe… I’m in Amsterdam and this is literally on the other side of the world, It’s rather impressive in a horrible way.
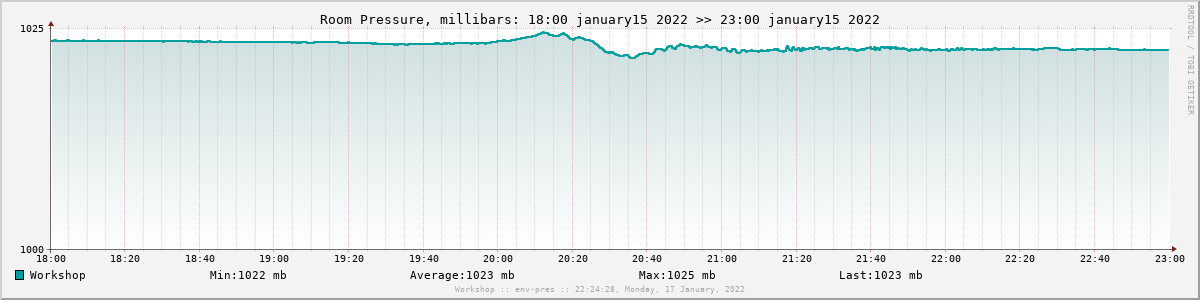
You can see in the zoomed-in trace the way the pressure goes slightly unstable following the main pressure wave. The sensor also captured the second wave at 4am, but it’s far less distinct.
Readings come from a BME280 sensor. The datalogging and graph come from my OverWatch project.