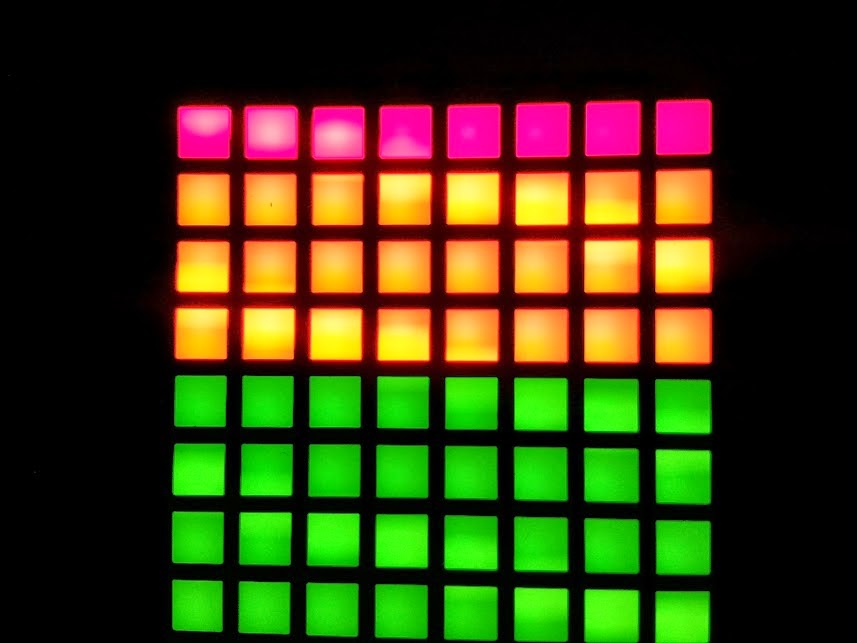
Plot the readings from a sensor over time on the @Adafruit_Industries bi-color LED matrix with different colors representing the magnitude of the reading: http://beagleboard.org/project/bbb-bicolor-matrix/
Plot the readings from a sensor over time on the @Adafruit_Industries bi-color LED matrix with different colors representing the magnitude of the reading: http://beagleboard.org/project/bbb-bicolor-matrix/